Financial Information
Financial Highlights
Key Figures
(Unit: Millions of yen)
| IFRS | IFRS | IFRS | IFRS | IFRS | |
|---|---|---|---|---|---|
| FY2020 | FY2021 | FY2022 | FY2023 | FY2024 | |
| The year ended March 31, 2021 |
The year ended March 31, 2022 |
The year ended March 31, 2023 |
The year ended March 31, 2024 |
The year ended March 31, 2025 |
|
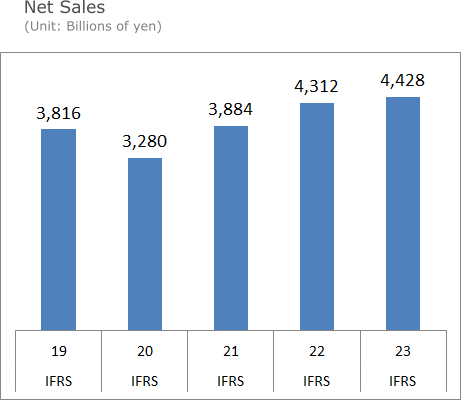
| Net Sales | 328,037 | 388,360 | 431,205 | 442,781 | 438,316 |
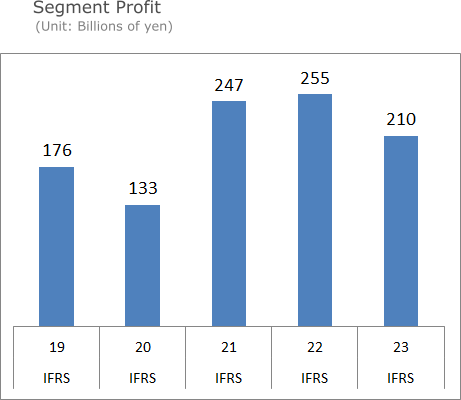
| Segment Profit | 13,325 | 24,713 | 25,500 | 20,959 | 19,825 |
| Operating Profit | 18,297 | 30,001 | 32,547 | 22,417 | 22,671 |
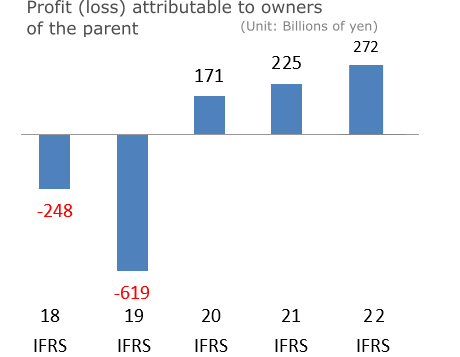
| Profit (loss) attributable to owners of the parent | 17,087 | 22,549 | 27,210 | 15,818 | 14,899 |
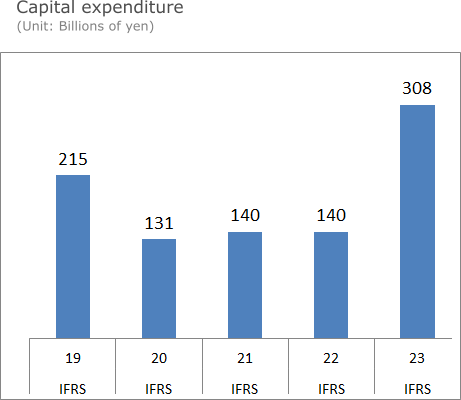
| Capital expenditure | 13,051 | 14,013 | 14,041 | 30,837 | 20,319 |
|---|---|---|---|---|---|
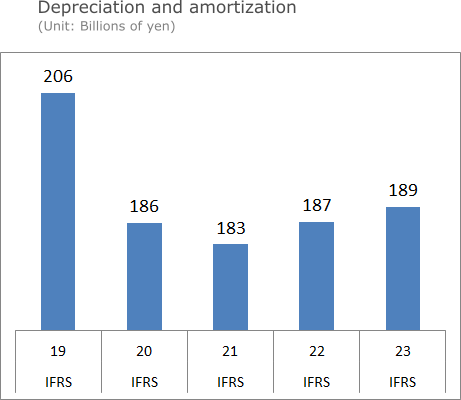
| Depreciation and amortization | 18,634 | 18,314 | 18,652 | 18,886 | 18,685 |
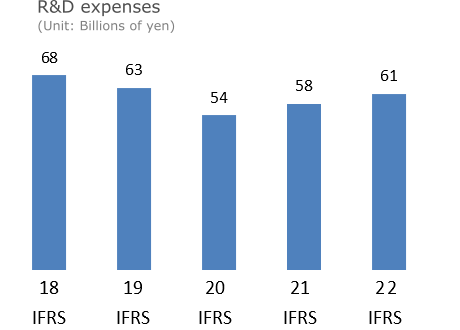
| R&D expenses | 5,368 | 5,767 | 7,139 | 7,589 | 7,839 |
| Cash flows from operating activities | 20,826 | 24,247 | 23,914 | 39,861 | 43,847 |
|---|---|---|---|---|---|
| Cash flows from investing activities | (6,281) | (10,871) | (13,517) | (23,503) | (34,133) |
| Cash flows from financing activities | 1,146 | (32,711) | (20,180) | (15,033) | (9,099) |
Per share data
(Unit: Yen)
| Profit (loss) attributable to owners of the parent (*1) | 334.47 | 427.48 | 514.20 | 294.79 | 281.13 |
|---|---|---|---|---|---|
| Cash dividends applicable to the year (*2) | 38.00 | 53.00 | 100.00 | 100.00 | 110.00 |
(Unit: Millions of yen)
| IFRS | IFRS | IFRS | IFRS | IFRS | |
|---|---|---|---|---|---|
| 31-Mar-21 | 31-Mar-22 | 31-Mar-23 | 31-Mar-24 | 31-Mar-25 | |
| Total assets | 426,635 | 434,187 | 446,836 | 476,530 | 463,112 |
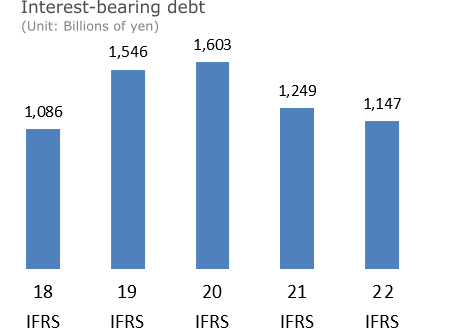
| Interest-bearing debt (*3) | 160,278 | 124,874 | 114,706 | 101,526 | 108,224 |
| Total liabilities | 309,910 | 273,273 | 255,800 | 250,122 | 228,089 |
| Equity attributable to owners of the parent | 110,683 | 153,411 | 182,830 | 217,191 | 225,537 |
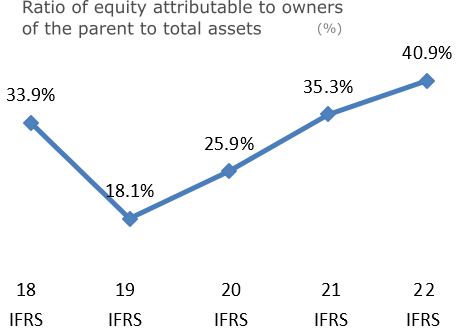
| Ratio of equity attributable to owners of the parent to total assets | 25.9% | 35.3% | 40.9% | 45.6% | 48.7% |
|---|---|---|---|---|---|
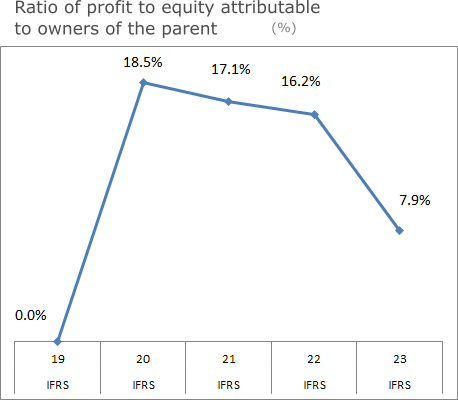
| Ratio of profit attributable to owners of the parent | 18.5% | 17.1% | 16.2% | 7.9% | 6.7% |
| Number of employees | 14,718 | 14,472 | 13,920 | 13,634 | 12,951 |
|---|
-
(*1)(*2) stated based on the 2‐for‐1 stock split on December 3, 2024
(*3) Interest-bearing debt= Short-term loans + Current portion of long-term debt + Current lease liability
+ Long-term debt + Non-Current lease liability + Guarantee deposits received.
