Financial Information
Segment Information
Net Sales
(Unit: Millions of yen)
| IFRS | IFRS | IFRS | IFRS | IFRS | ||
|---|---|---|---|---|---|---|
| FY2020 | FY2021 | FY2022 | FY2023 | FY2024 | ||
| The year ended March 31, 2021 |
The year ended March 31, 2022 |
The year ended March 31, 2023 |
The year ended March 31, 2024 |
The year ended March 31, 2025 |
||
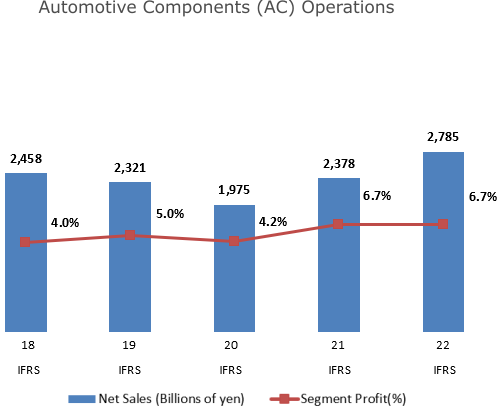
| Automotive Components (AC) Operations | 197,453 | 237,783 | 279,692 | 293,033 | 307,632 | |
| Shock absorbers for automobiles | 142,723 | 169,159 | 202,161 | 214,924 | 227,910 | |
| Shock absorbers for motorcycles | 26,087 | 34,868 | 45,904 | 41,312 | 43,751 | |
| Hydraulic equipment for automobiles | 24,753 | 23,875 | 21,045 | 22,709 | 21,054 | |
| Others | 3,890 | 9,880 | 10,583 | 14,088 | 14,917 | |
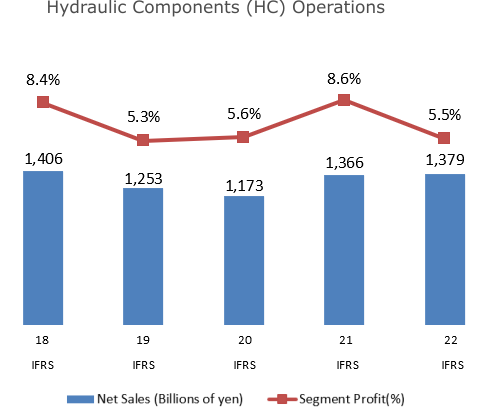
| Hydraulic Components (HC) Operations | 117,338 | 136,636 | 137,876 | 134,433 | 116,173 | |
| Hydraulic equipment for industrial use | 103,973 | 128,716 | 130,346 | 124,549 | 106,385 | |
| System Products | 3,890 | 9,880 | 10,583 | 6,612 | 6,319 | |
| Others | 7,375 | 3,287 | 3,502 | 3,272 | 3,469 | |
| Aircraft Components | 3,857 | 3,655 | 4,416 | 3,908 | 3,678 | |
| Aircraft Components | 3,857 | 3,655 | 4,416 | 3,908 | 3,678 | |
| Special-purpose Vehicles and others | 9,389 | 10,286 | 9,221 | 11,407 | 10,832 | |
| Special-purpose Vehicles | 8,282 | 9,155 | 9,221 | 11,407 | 10,832 | |
| Others | 1,107 | 1,132 | - | - | - | |
| Total | 328,037 | 388,360 | 431,205 | 442,781 | 438,316 | |
Segment Profit (*1)
(Unit: Millions of yen)
| IFRS | IFRS | IFRS | IFRS | IFRS | |
|---|---|---|---|---|---|
| FY2020 | FY2021 | FY2022 | FY2023 | FY2024 | |
| The year ended March 31, 2021 |
The year ended March 31, 2022 |
The year ended March 31, 2023 |
The year ended March 31, 2024 |
The year ended March 31, 2025 |
|
| Automotive Components (AC) Operations | 8,196 | 15,979 | 18,793 | 16,460 | 17,167 |
| Hydraulic Components (HC) Operations | 6,554 | 11,776 | 7,527 | 5,435 | 1,721 |
| Aircraft Components | (2,461) | (3,960) | (1,425) | (2,038) | (392) |
| Special-purpose Vehicles and others | 1,037 | 918 | 605 | 1,102 | 1,330 |
| Total | 13,325 | 24,713 | 25,500 | 20,959 | 19,825 |
Net Sales by Region
(Unit: Millions of yen)
| IFRS | IFRS | IFRS | IFRS | IFRS | |
|---|---|---|---|---|---|
| FY2020 | FY2021 | FY2022 | FY2023 | FY2024 | |
| The year ended March 31, 2021 |
The year ended March 31, 2022 |
The year ended March 31, 2023 |
The year ended March 31, 2024 |
The year ended March 31, 2025 |
|
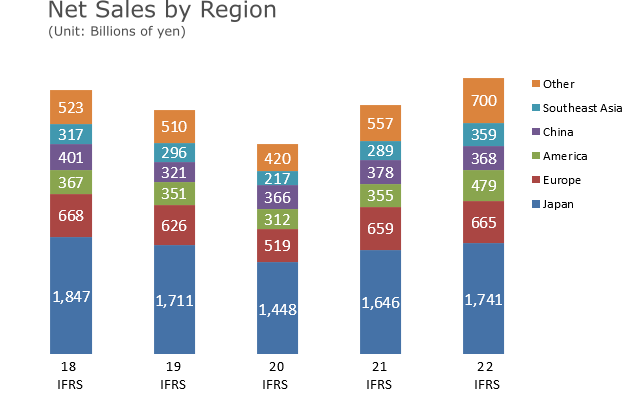
| Japan | 144,761 | 164,564 | 174,147 | 183,682 | 163,742 |
| Ratio to Net Sales | 44.1% | 42.4% | 40.4% | 41.5% | 37.4% |
| Europe | 51,879 | 65,940 | 66,480 | 72,528 | 84,333 |
| Ratio to Net Sales | 15.8% | 17.0% | 15.4% | 16.4% | 19.2% |
| America | 31,184 | 35,456 | 47,888 | 52,290 | 52,392 |
| Ratio to Net Sales | 9.5% | 9.1% | 11.1% | 11.8% | 12.0% |
| China | 36,605 | 37,774 | 36,756 | 24,197 | 24,342 |
| Ratio to Net Sales | 11.2% | 9.7% | 8.5% | 5.5% | 5.6% |
| Southeast Asia | 21,651 | 28,920 | 35,928 | 32,357 | 30,484 |
| Ratio to Net Sales | 6.6% | 7.4% | 8.3% | 7.3% | 7.0% |
| Others | 41,957 | 55,708 | 70,006 | 77,727 | 83,024 |
| Ratio to Net Sales | 12.8% | 14.3% | 16.2% | 17.6% | 18.9% |
| Total | 328,037 | 388,360 | 431,205 | 442,781 | 438,316 |
Net Sales by Region (Details)
(Unit: Millions of yen)
| IFRS | IFRS | IFRS | IFRS | IFRS | |
|---|---|---|---|---|---|
| FY2020 | FY2021 | FY2022 | FY2023 | FY2024 | |
| The year ended March 31, 2021 |
The year ended March 31, 2022 |
The year ended March 31, 2023 |
The year ended March 31, 2024 |
The year ended March 31, 2025 |
|
| Japan | 144,761 | 164,564 | 174,147 | 183,682 | 163,742 |
| AC | 54,862 | 62,925 | 71,143 | 77,424 | 73,599 |
| HC | 79,892 | 92,031 | 94,160 | 96,120 | 80,122 |
| Others | 10,007 | 9,608 | 8,845 | 10,138 | 10,021 |
| Europe | 51,879 | 65,940 | 66,480 | 72,528 | 84,333 |
| AC | 47,254 | 57,430 | 58,304 | 65,040 | 77,052 |
| HC | 4,626 | 8,510 | 8,176 | 7,488 | 7,281 |
| Others | 0 | 0 | 0 | 0 | 0 |
| America | 31,184 | 35,456 | 47,888 | 52,290 | 52,392 |
| AC | 24,005 | 27,644 | 38,151 | 42,640 | 44,545 |
| HC | 6,269 | 7,220 | 9,177 | 9,378 | 7,593 |
| Others | 910 | 592 | 559 | 272 | 254 |
| China | 36,605 | 37,774 | 36,756 | 24,197 | 24,342 |
| AC | 18,430 | 21,425 | 22,531 | 15,391 | 15,742 |
| HC | 18,175 | 16,348 | 14,225 | 8,807 | 8,600 |
| Others | 0 | 0 | 0 | 0 | 0 |
| Southeast Asia | 21,651 | 28,920 | 35,928 | 32,357 | 30,484 |
| AC | 19,815 | 25,629 | 31,918 | 27,611 | 26,199 |
| HC | 1,831 | 3,278 | 4,007 | 4,746 | 4,284 |
| Others | 5 | 12 | 2 | 0 | 0 |
| Others | 41,957 | 55,708 | 70,006 | 77,727 | 83,024 |
| AC | 33,088 | 42,730 | 57,645 | 64,927 | 70,495 |
| HC | 6,545 | 9,248 | 8,130 | 7,894 | 8,294 |
| Others | 2,324 | 3,729 | 4,231 | 4,907 | 4,235 |
| Total | 328,037 | 388,360 | 431,205 | 442,781 | 438,316 |
| AC | 197,453 | 237,783 | 279,692 | 293,033 | 307,632 |
| HC | 117,338 | 136,636 | 137,876 | 134,433 | 116,173 |
| Others | 13,246 | 13,941 | 13,637 | 15,315 | 14,511 |


